Solar Component to Sea Level Rise
19 August 2015 Leave a comment
A periodogram of the TOPEX and Jason data show an 11 year period in the sea level data.
The University of Colorado Sea Level Research Group publishes monthly data for the Global Mean Sea Level. The data can be downloaded here. It is a combination of data from Jason-1, Jason-2 and TOPEX. It is the data that was used by Dr. Shaviv et al. in their paper.
Unfortunately, the data file contains the date in decimal years format (e.g., “1993.0409”). I wrote a program to convert the decimal years to year-month-day format. The data is reported approximately every 10 days (but sometimes there are 20 days between data values), which means there are two or three data values per month. The periodogram works best if the time between measurements are all the same. So I wrote another program to average the values for each month. That way the data is in monthly format (available here; sorry its a Word document because WordPress will not let me load text files into my media library). I then used the following R-code to read the data, calculate the periodogram and plot the result, which is shown in Figure 1.
sldat <- read.table( "c:/temp/sl_global_avg.txt", header = TRUE, row.names=1)

slpgram <- spec.pgram( sldat, plot = FALSE)

plot(slpgram, log="no", main="Sea Level\nRaw Periodogram",lty=1,col="black" )
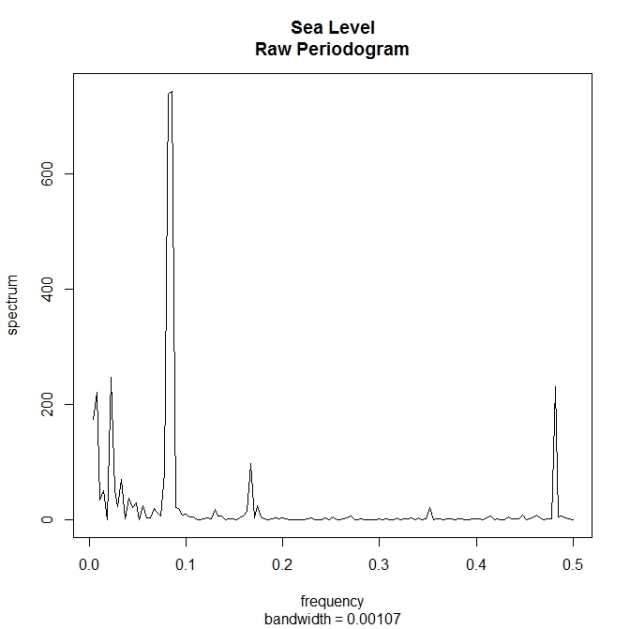
The frequencies and periods of the five heighest peaks in Figure 1 are shown in Table 1. The period in months is obtained by taking the recipricol of the frequency. The period in years is obtained by dividing the period in months by 12 months/year. Figure 2 shows a close-up view of the first frequency peak at 0.00740 month-1.
| Frequency | Period | Period |
|---|---|---|
| month-1 | months | years |
| 0.00740 | 135 | 11 |
| 0.0222 | 45 | 4 |
| 0.0852 | 11.7 | 1 |
| 0.167 | 6 | 0.5 |
| 0.481 | 2.1 | 0.2 |
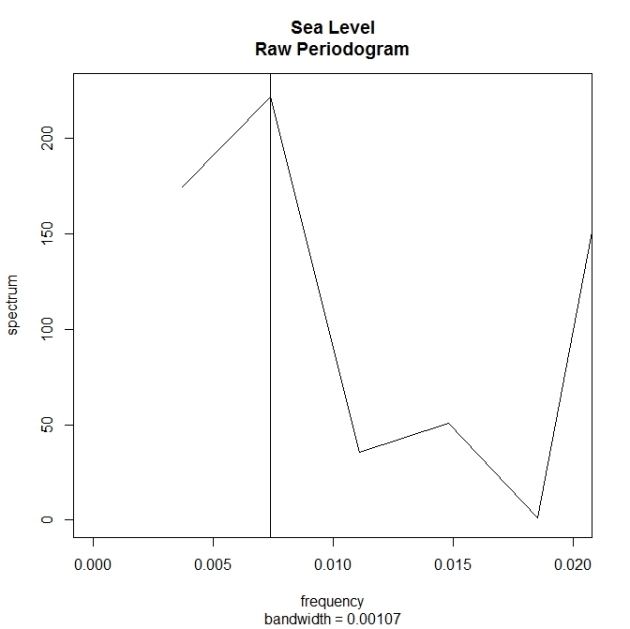
The data shows an unmistakable peak at a frequency of 0.00740 month-1. That is, the data shows an unmistakable peak at a period of 11 years, which is roughly the same as the solar cycle. Therefore, Dr. Shaviv and his collegues are justified in assuming a harmonic solar component in the sea level data.
